What you watch is how you vote
The outcome of America's recent presidential race sent shockwaves across the world. Donald Trump, a populist, wealthy, reality TV star beat the odds to win. As pundits of every stripe still continue to scratch their heads to explain the result, the New York Times posted a fascinating article earlier this week that may explain his victory and how cultural preferences are redrawing the political boundaries within America and across the world.
If we are what we watch, then it seems we also vote that way. This was most literally proven in the case of Donald Trump- best known for his television role in The Apprentice. Vast swathes of America believed the edited, stylised image of the man on TV- successful, brash, wealthy- was the man they wanted as their president. Conversely, even more Americans decided not to vote for that very image. Either way, it was the image of Trump in the media that they made a decision on, and not the person himself. This growing rift between communities, that manifests itself in the media they consume, and I posit, in the way they vote, is redrawing political boundaries across the planet. We'd be foolish to ignore this reality.
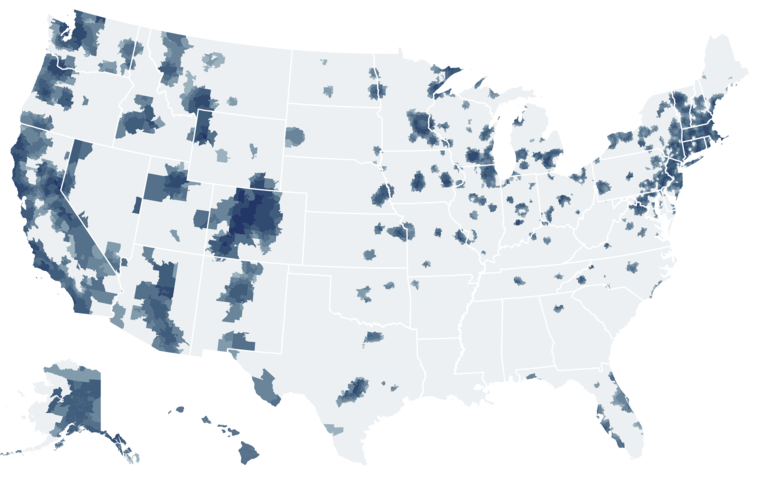
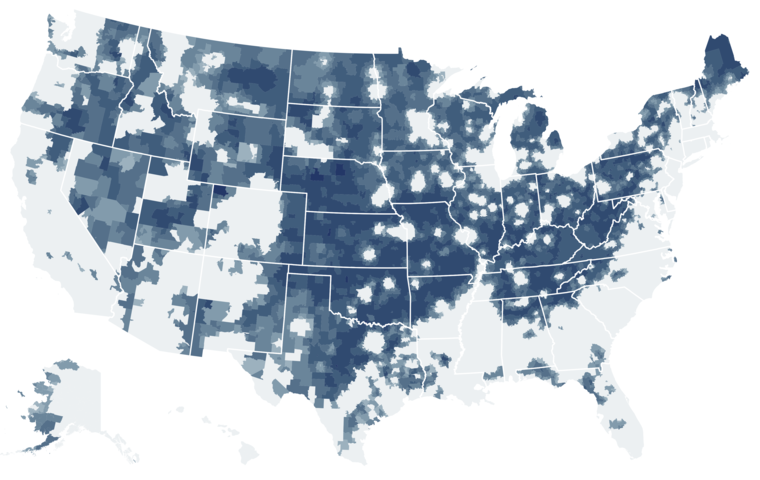
Take a look at the maps below that appeared in the New York Times's article I mentioned: ‘Duck Dynasty’ vs. ‘Modern Family’: 50 Maps of the U.S. Cultural Divide. They present a contrasting picture of an increasingly divided USA.
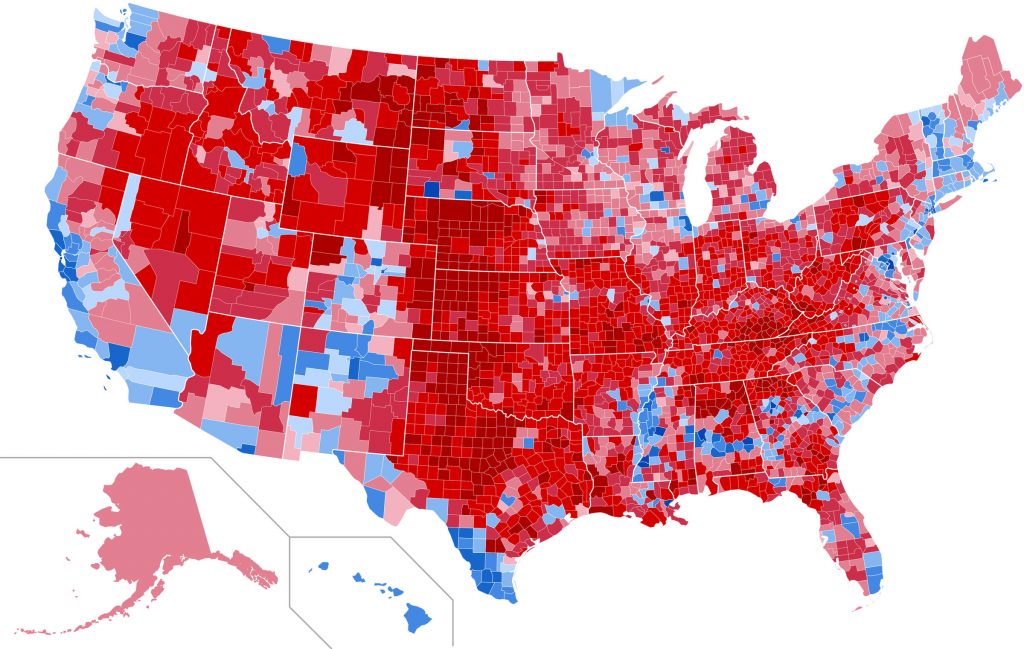
Strikingly, these two maps, with some minor exceptions, mirror the map below from michiganradio.org that describes the 2016 US election outcome (by district).
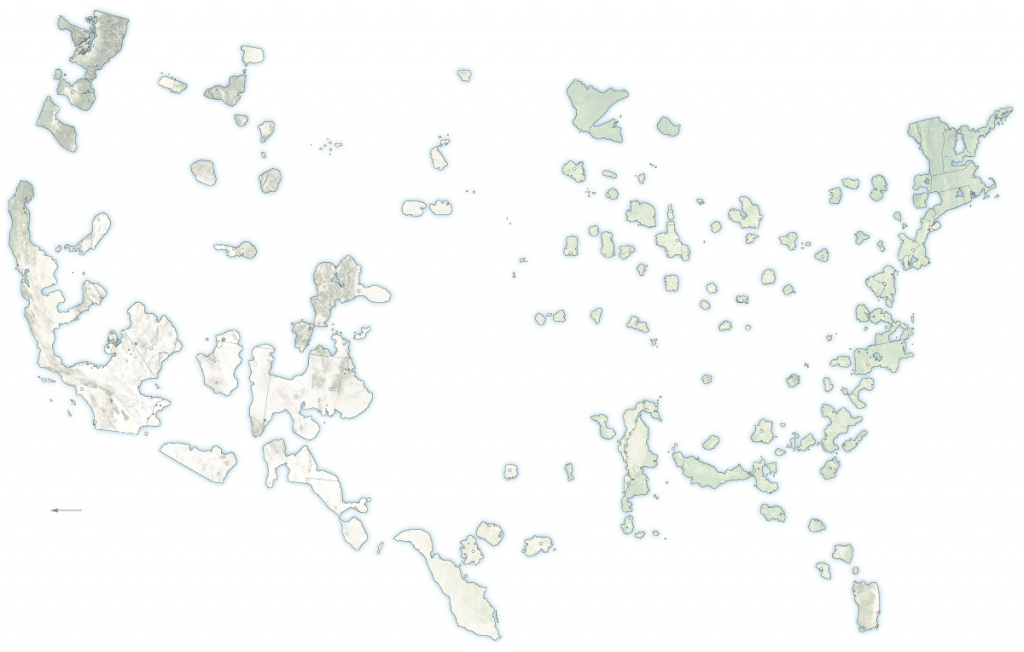
Indulge me for a moment and imagine the thin, white state lines to have vanished. What you have is a new political geography and a country divided along lines of current cultural preference, and no longer beholden to history or the differences between states. Following the election, Tim Wallace (@WallaceTim) in his piece in the New York Times titled The Two Americas of 2016 describes "two new imaginary nations". Take a look at the fascinating maps he produced (sample below). Wallace writes vividly about this new geography; "While Trump country is vast, its edges have been eroded by coastal Democrats, and it is riddled with large inland lakes of Clinton voters who were generally concentrated in dense urban areas." The data shows that while the districts Trump won cover 85% of the country, they only accounted for 46% of the vote, while Clinton's winnings covered only 15% of the country but accounted for 54% of the vote.
The map below that shows where Clinton's support lay. It eerily mirrors the first map on this page that identifies where viewers of more liberal, global TV shows live.
Regional tastes and differences are also redrawing India's political geography. In writing for the Carnegie Endowment for International Peace, Milan Vaishnav (@MilanV) tracks the increasing number of parties in India's national elections. He writes in his piece Five Trends Shaping India's Voting Landscape; "The 1989 election heralded the end of single-party rule in India and the rise of multiparty coalition government, which is likely to continue for the foreseeable future. This further incentivized the growth of regional parties, whose leaders recognized that they could wield considerable influence in the formation of governments with a relatively small number of seats in parliament." He notes that the number of parties fielding candidates in India's national election jumped from 38 in 1984 to 117 in 1989 and to 370 in 2009. According to Wikipedia, there were a whopping 1,761 registered national parties as of September 2016. There were 1,900 channels broadcasting in India in 2009. If we could get a hold of viewership data for 2016 for the thousands of channels that overwhelm your remote, we could draw a map of India that looks very different from the one we're all used to, just as the New York Times did for the USA.
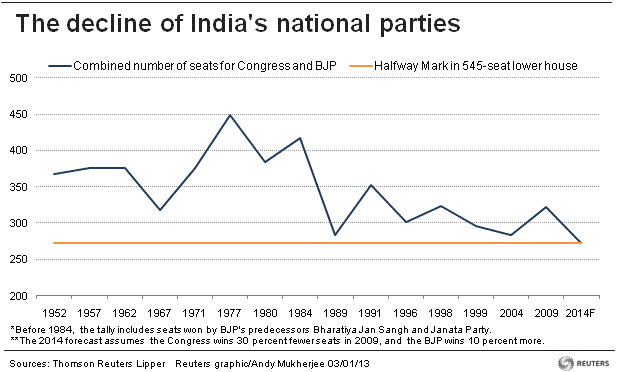
Even without that data, it is clear that India is becoming more of an amalgam of regional flavours. State boundaries are beginning to look meaningless and are being redrawn. The creation of Uttarakhandand Telangana are two examples. Despite the BJP winning a majority mandate nationally in 2014, there is a growing regionalization of political preferences in India. In his piece for Reuters titled Centre cannot hold (and as illustrated in the graph below), Andy Mukherjee (@AndyMukherjee70) documents how the collective heft of India's national parties is being eroded by regional parties representing local interests. He believes that the days of a single party ever gaining a majority may be nearing an end. In order to survive and hold on to power, the Congress and BJP have had to compromise with and build alliances with an array of geographically and politically diverse regional parties. If we are what we watch, then the future of India is one of regional preferences. The most watched TV station in India in 2016 was Sun TV. It broadcasts in the regional language of Tamil, and not the national language of Hindi.

